Learning with Data

This Saturday, February 11th, 2017, I will be hosting a webinar for SimpleK12 on Learning with Data. The webinar is free and you can sign up to register here.
In this webinar, I will share all different types of tools and sites for teaching and learning about data.
Here are a few of the resources I will be sharing in the webinar:
1. Collecting Data- I've started compiling a list of sites that allow students and teachers to find and download data. I'll be sharing the collection in the webinar. It probably isn't too surprising that Google Trends is one of my favorite sites to find interesting data.
Here is a graph I created using the Numbers program on my Mac after exporting data about Valentine's Day from Google Trends--

In the webinar, I will show several other sites that can be used to collect and compare data.
#2 - Graphing and Charting Tools-
It doesn't get much easier than this Easy Bar Graph site. Elementary students will be able to use this independently.
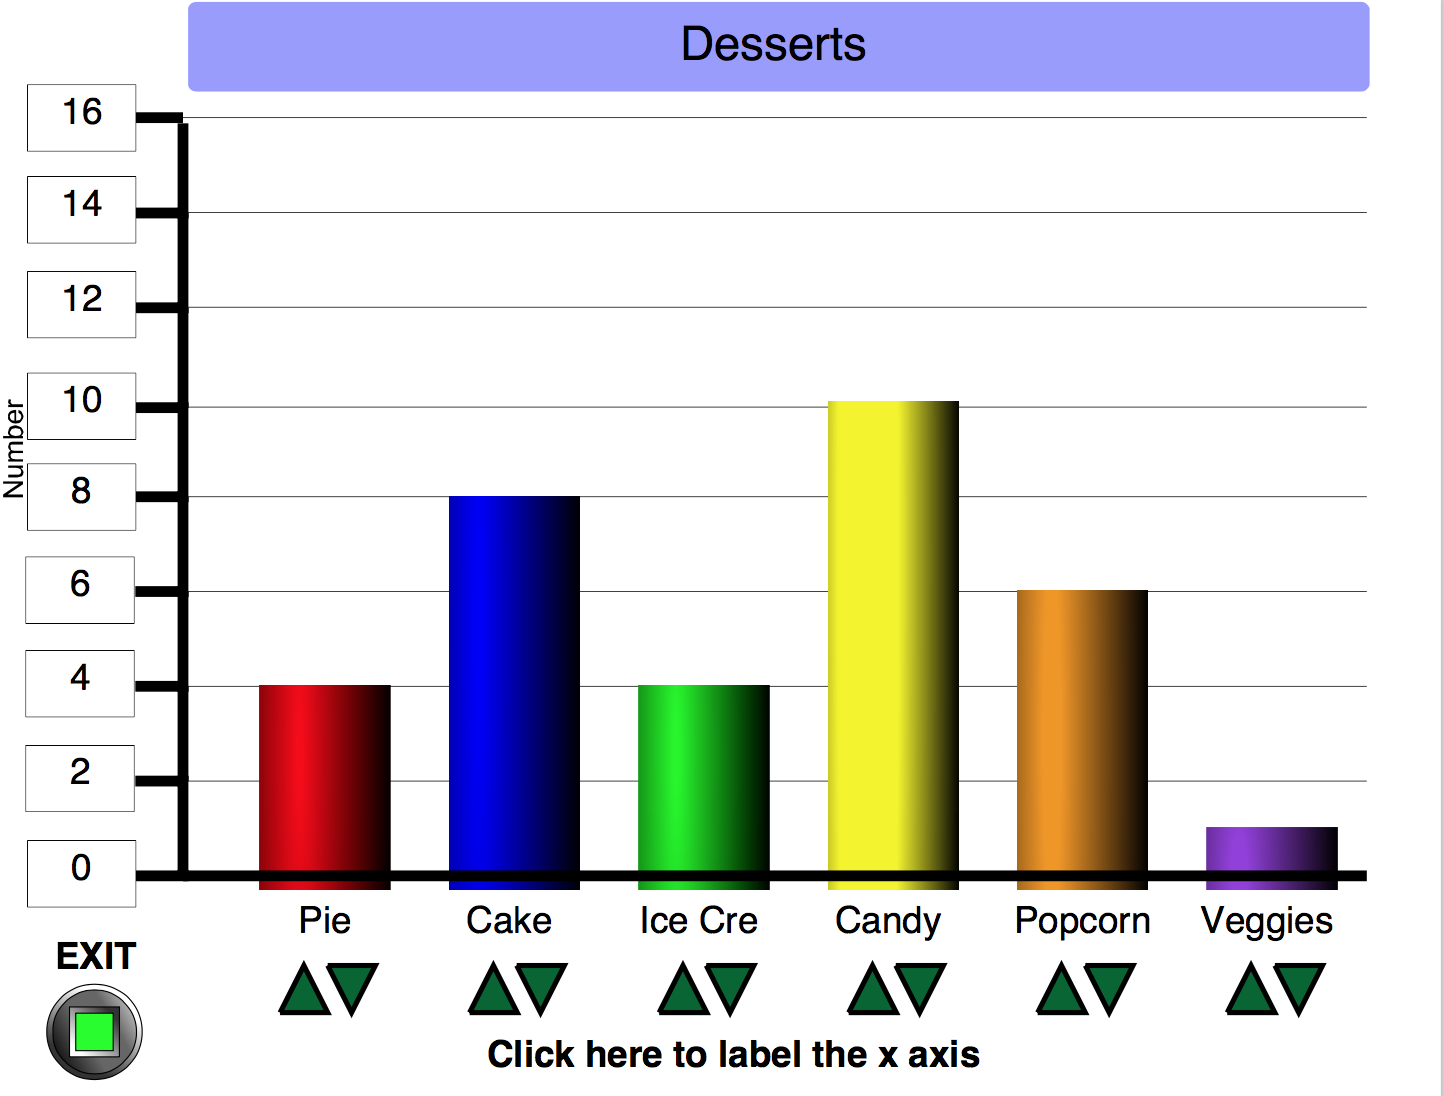
Create a Graph from Kids' Zone is a wonderful site for seeing sample graphs as well as creating different types of graphs.

In the webinar I will also be demonstrating how Google Sheets, Docs and Slides integrate together for showing data, tables, charts and graphs.
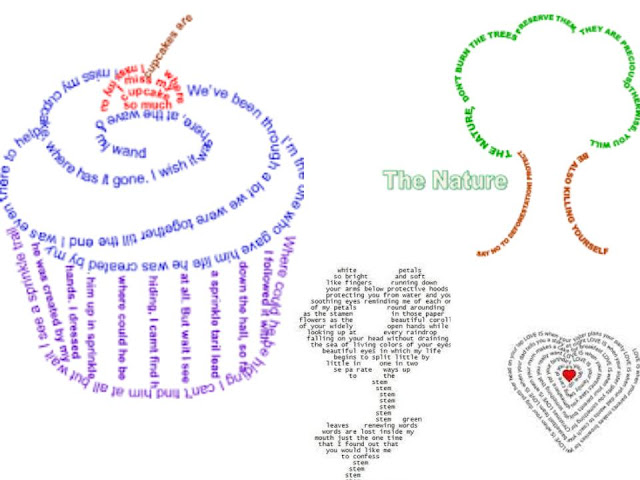
3. Story Telling and Data Visualization- I think this is the best part! Infographics, animations, and unique types of graphs can be really fun.
Check out this interactive map from the United States Census Bureau. It allows for filtering of data as well as comparing data of different states. There are many other interactive maps to explore on this site as well.

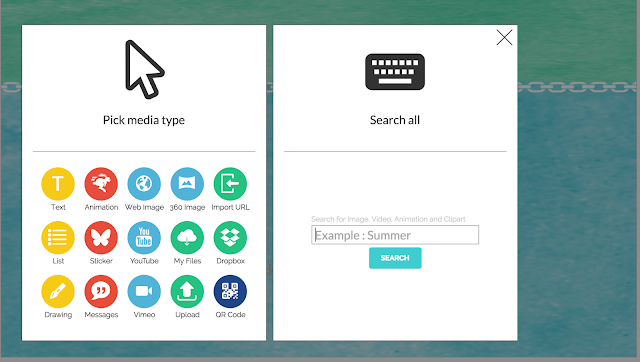
Did you know that you can use Piktochart to import your own data from a file or from a Google Sheet and create various types of graphs and charts to include in your infographic, presentation or printable poster? I will be demonstrating how to do this in the webinar. Here is an example Piktochart I created from a Google Spreadsheet I made about SnapChat usage.
 |
| Click here to view the Piktochart |
Check out these interactive visuals that tell data stories.
When do Americans Leave for Work? Click here to see the map and then click on the play button to see the animation.

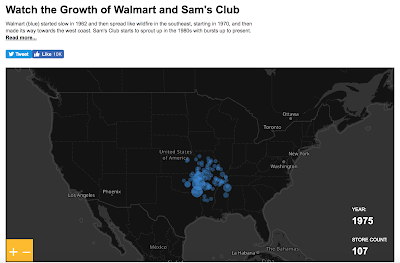


Growth of Walmart. Click here for the interactive map.

This history of Earth in the Context of a Football Field. Click here for the video.

I will be showing additional storytelling and data visualization tools in the webinar this Saturday.

Remember, complex data is all around us
- online
- in the news
- in our environment
Students can develop critical skills in making meaning from complex data and emerge better prepared for a data-rich world.
Do you have any great sites or tools for working with data? Please share with me. I would love to add more tools to my toolbox.

Please feel free to join me in the webinar for SimpleK12 and take advantage of some of the other wonderful webinars happening this Saturday as well.
Do you have any great sites or tools for working with data? Please share with me. I would love to add more tools to my toolbox.
Please feel free to join me in the webinar for SimpleK12 and take advantage of some of the other wonderful webinars happening this Saturday as well.
Comments